PicSee tracks first-party click data for every short link, and all registered users can view the analytics for each of their links.
Analytics Overview
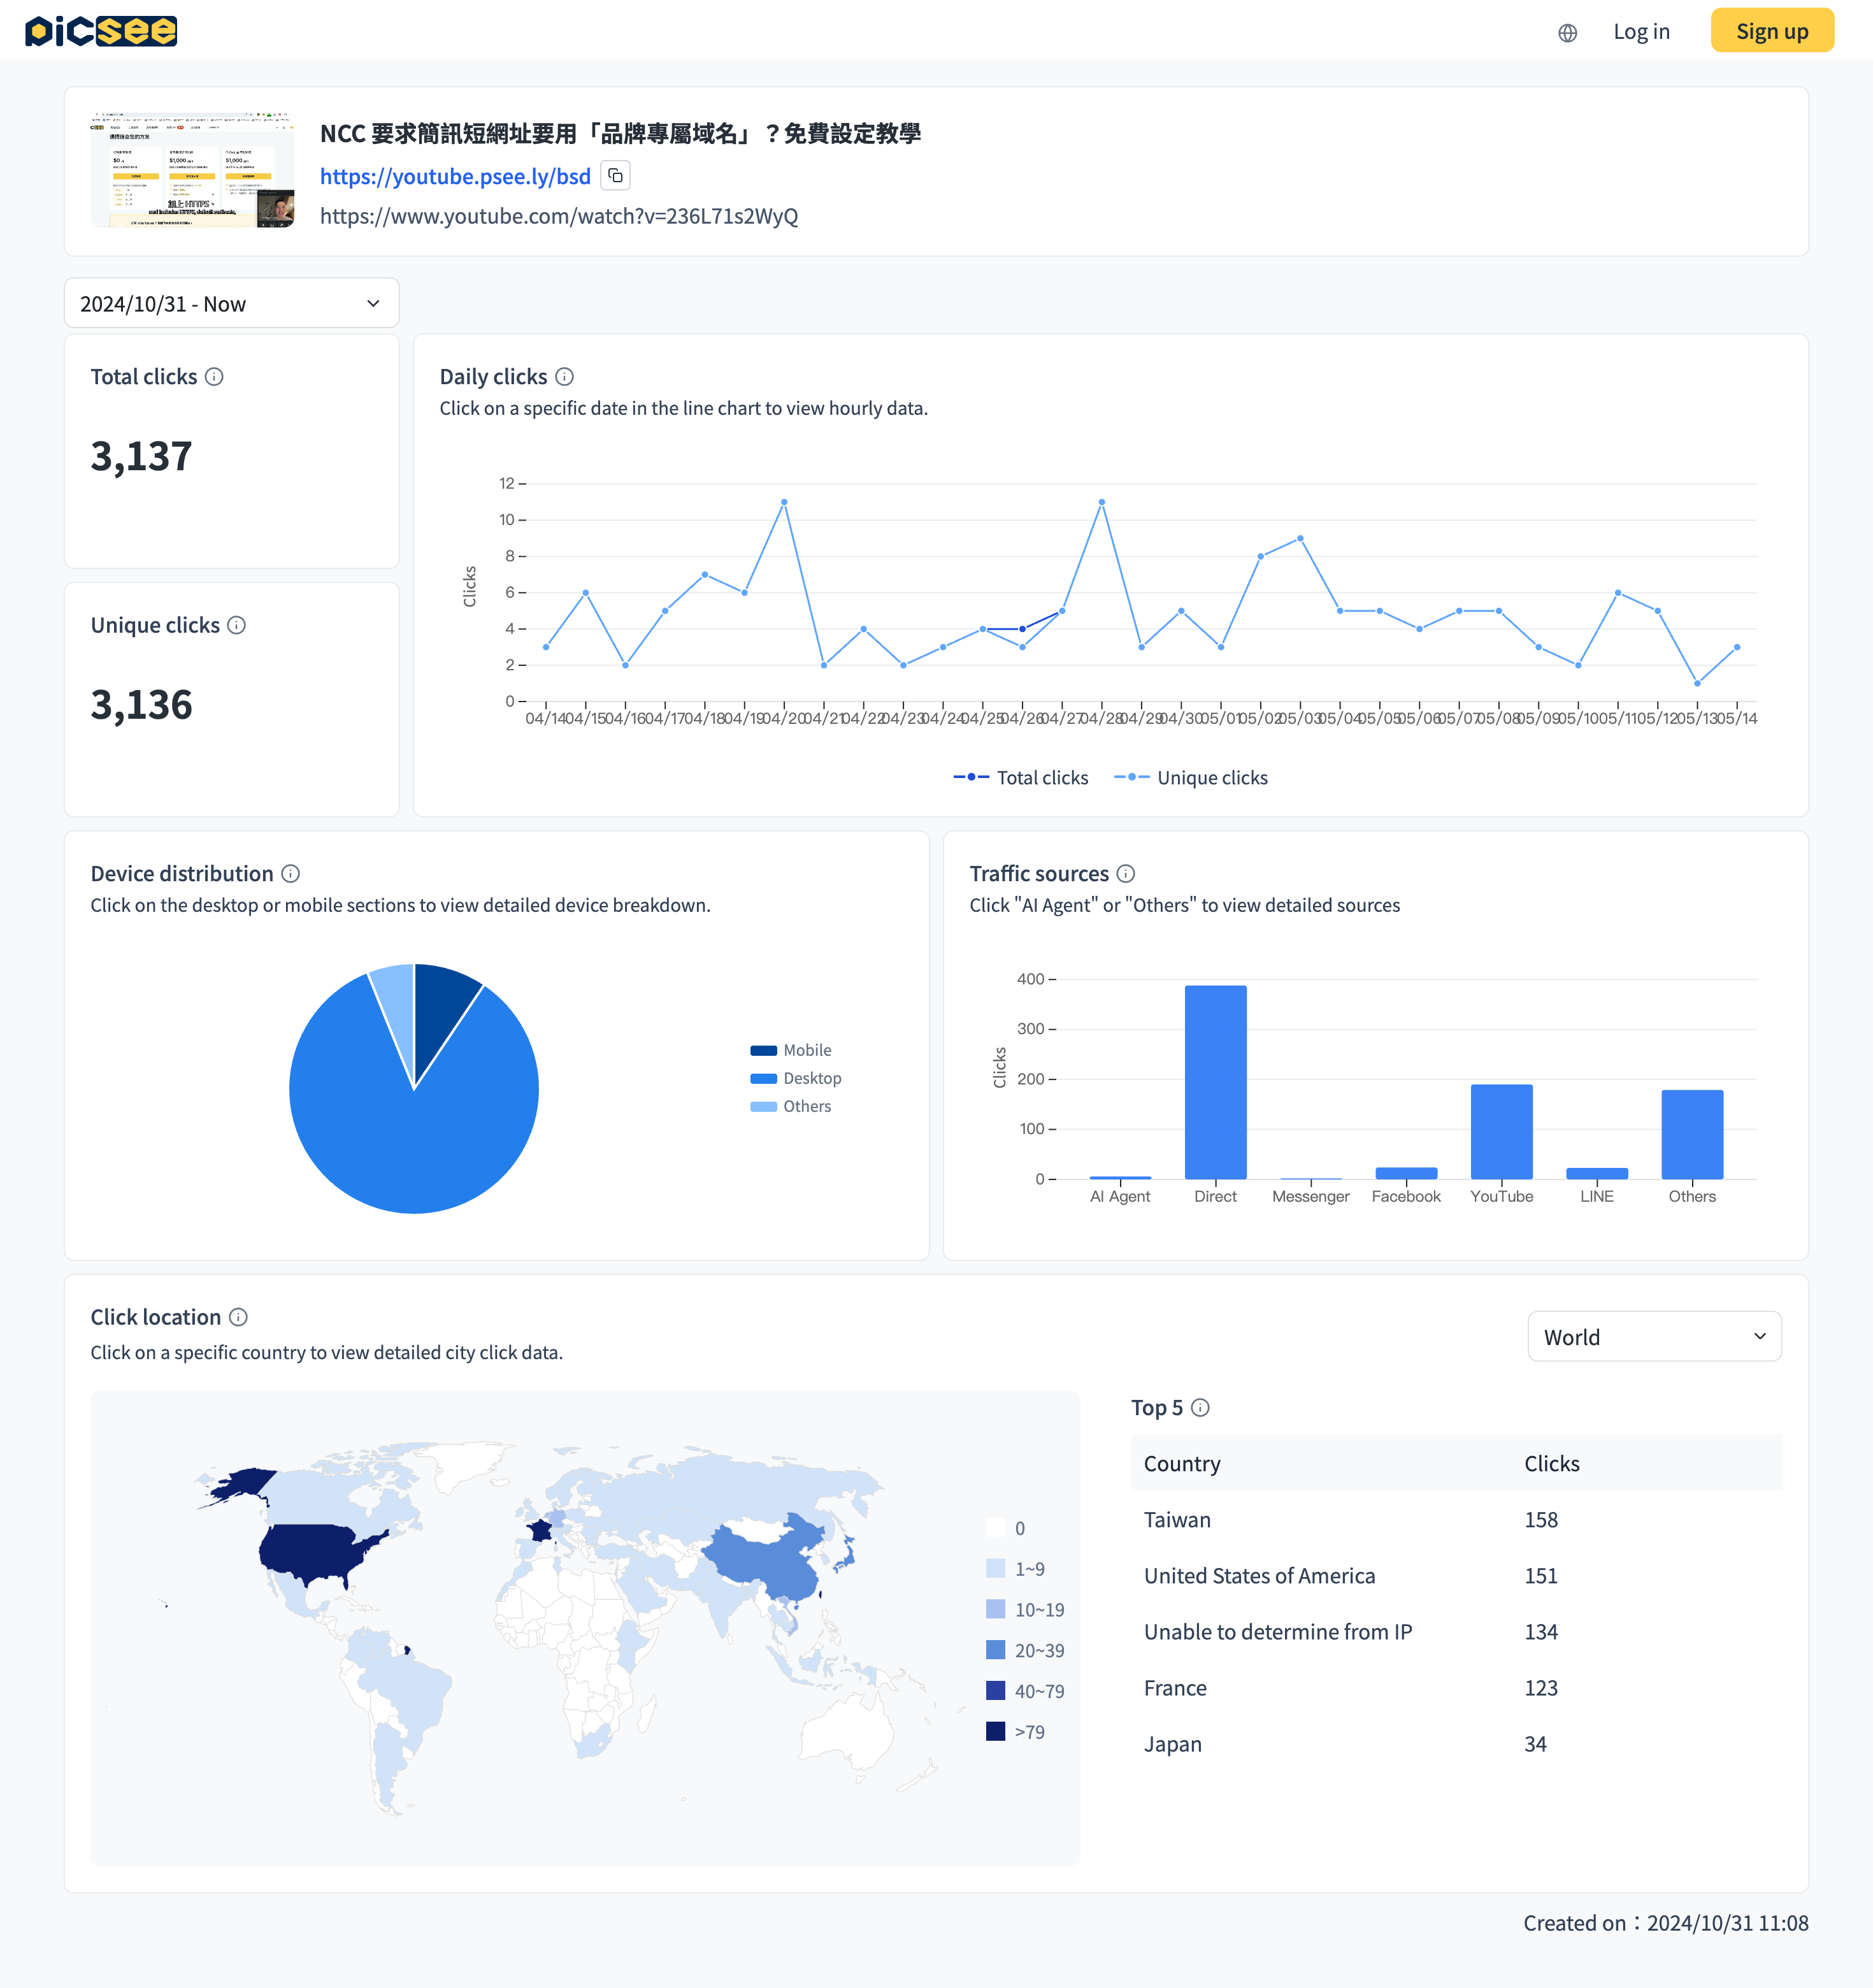
The screenshot below shows a sample links analytics page. From top to bottom, left to right, it displays: basic link info, date filter, total clicks, unique clicks, daily/hourly clicks, device breakdown, click sources, click locations, and more.
Each metric has an (i) icon next to its title. We recommend reading these alongside the data.
Data Highlights
Both free and paid plans can access the analytics page by default. Here are some of PicSee's key analytics strengths.
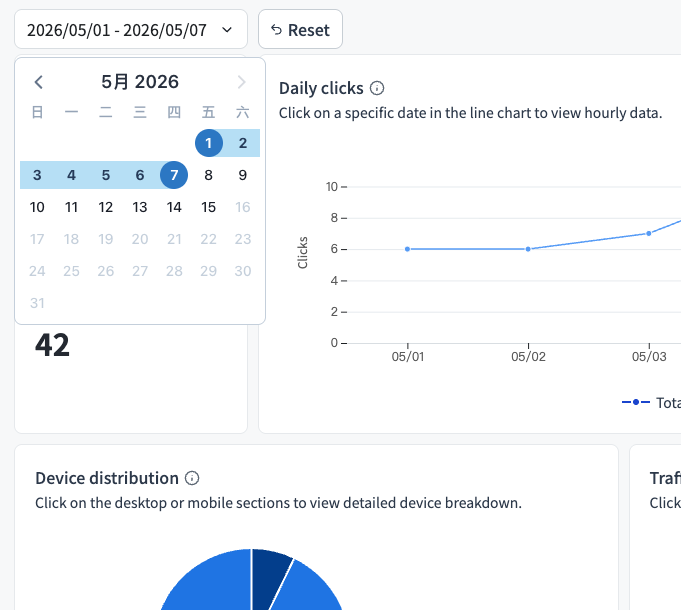
- Filter all data by date range: Select a specific date range to observe all metrics within that period. For example, if you ran a marketing campaign last week, filter to that week to compare click sources.
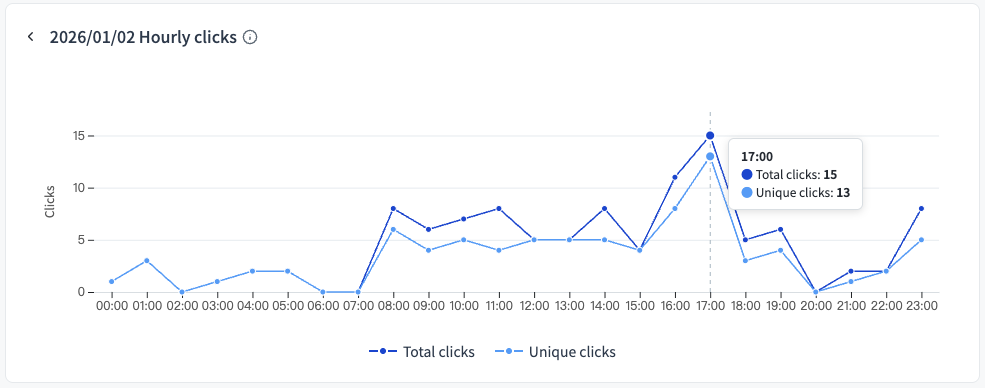
- Hourly click data: In Google Analytics, viewing hourly data requires complex custom reports. In PicSee, simply click on a specific date in the "Daily Clicks" chart to drill down to hourly data, with a maximum delay of just 5 minutes.
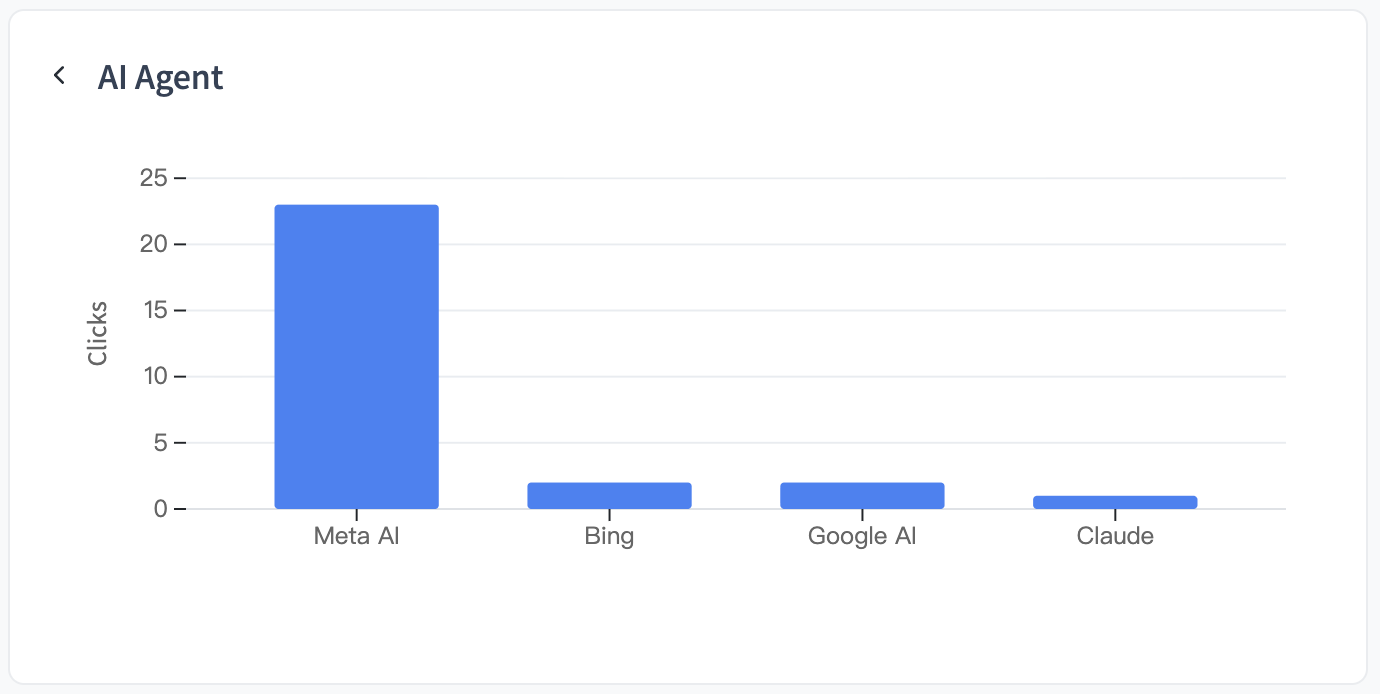
- Click sources include AI Agents: To optimize for AEO/GEO, you need to know whether your content is being indexed by AI. Expand the "AI Agent" bar in click sources to see how often major AI crawlers have fetched that short link. We also display popular platforms like LINE / Threads separately for a clearer breakdown of your traffic sources!
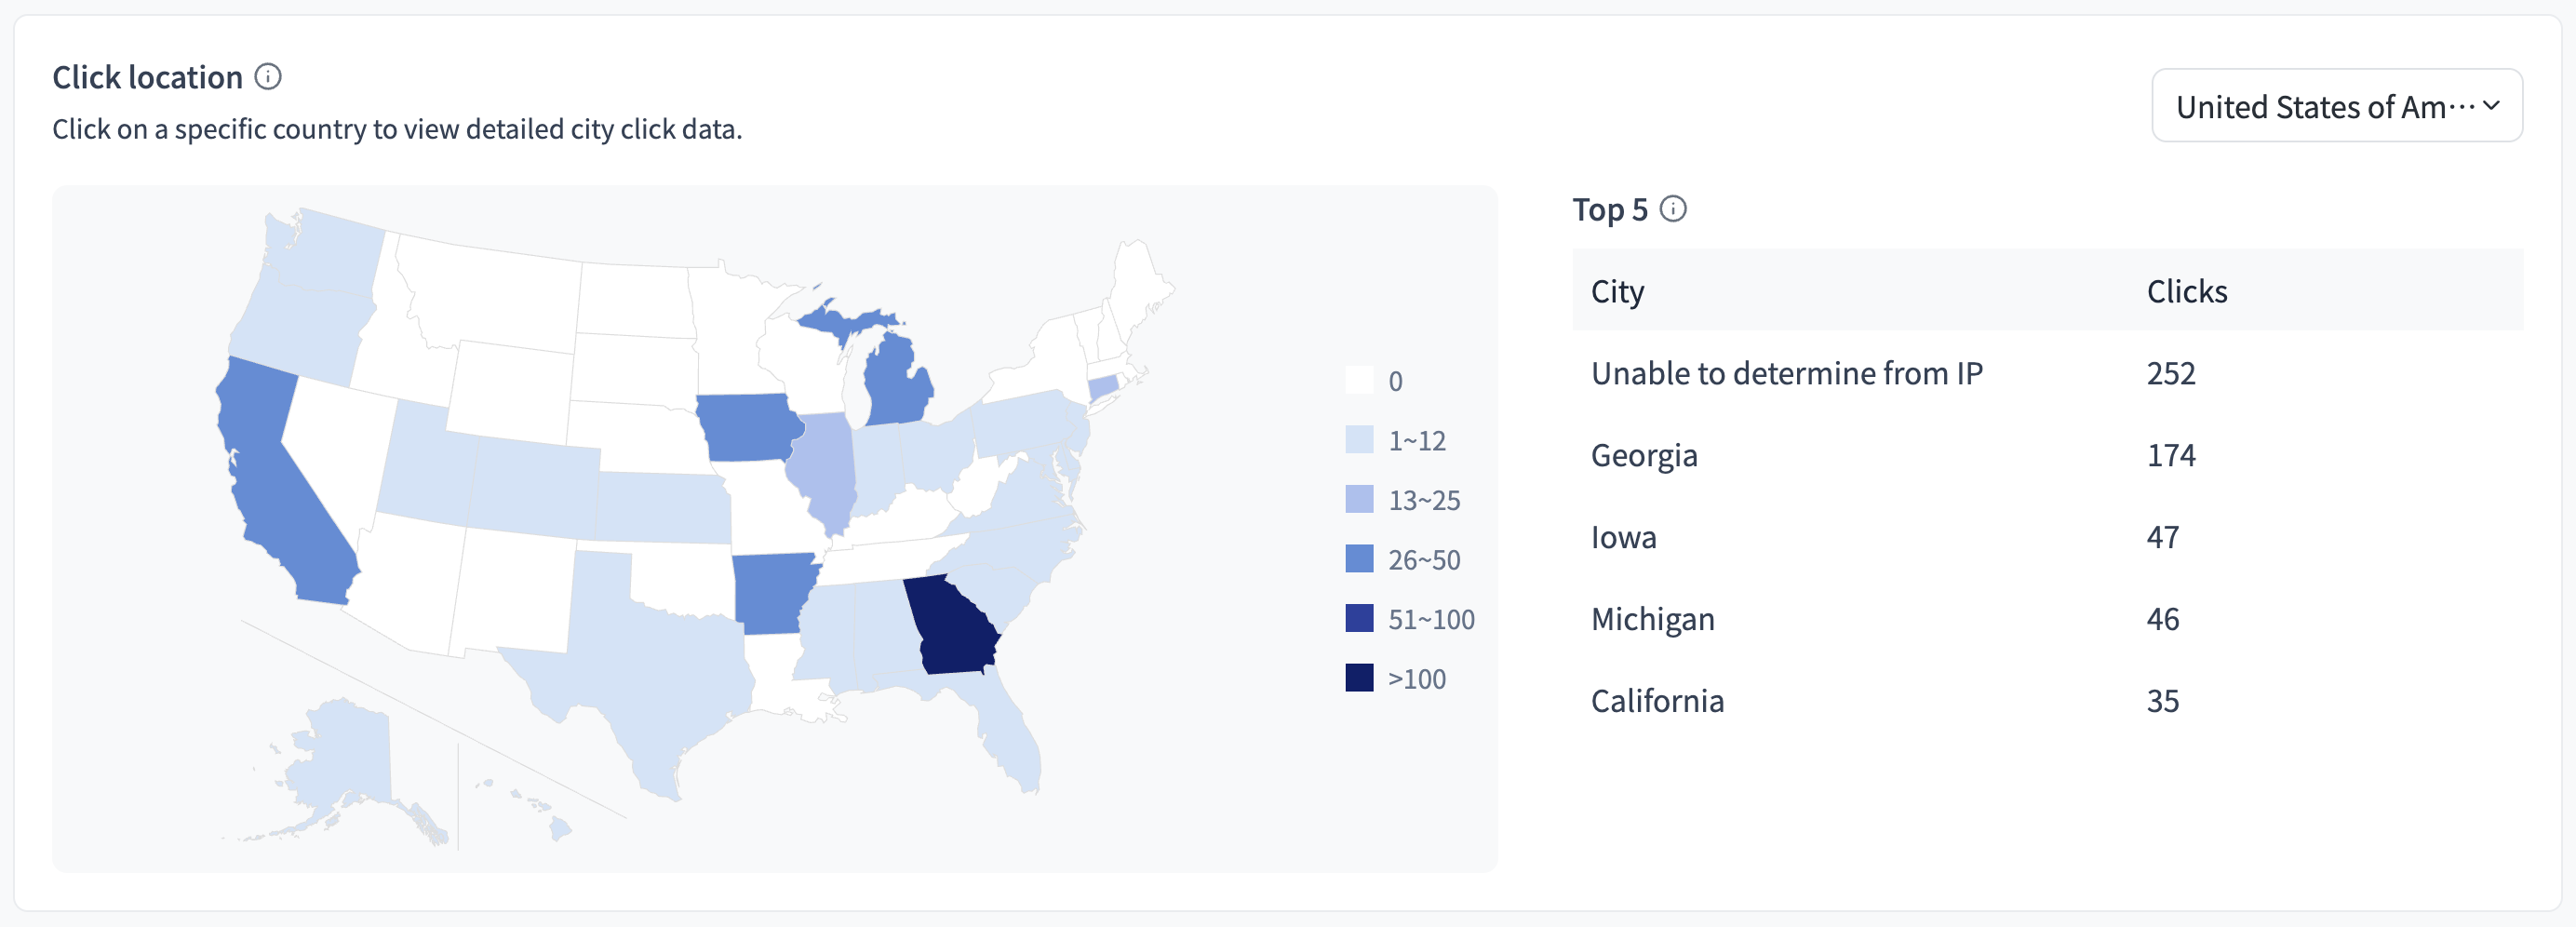
- Geographic data down to city/region: In the geographic chart, click on a country to drill down to city or region level, helping marketers understand where their audience is located.
Note: Free plan users who exceed 10,000 total clicks will need to upgrade to unlock full analytics. With an Initial plan or above, you can also export your analytics data!
FAQs
- Two ways to access the analytics page: By default, you can only view analytics for short links you created. If you are the creator, append a "plus sign" to the short link (e.g., https://pse.is/4nfth2+) to open the analytics page. You can also access it from the Links page by clicking the number in the "Analytics" column.
- How are clicks counted? Why might they be higher than Google Analytics: When a viewer clicks a short link, the system filters out bot traffic and records the click in the database. Each recorded click represents an actual redirect. However, differences in counting methods across platforms can cause discrepancies; for example, Google Analytics only counts a session after JavaScript executes, which is why PicSee's numbers may be higher.
- How unique clicks are counted: PicSee sets a cookie in the viewer's browser at the moment of the click, and uses the presence of that cookie to determine whether subsequent clicks are duplicates. This means the same viewer clicking from a different browser, incognito window, device, or after clearing cookies may be counted again.
- How is click source determined? Why does it show as Direct: Click source is determined by the browser's referrer (unrelated to UTM parameters). When PicSee cannot detect a referrer, the click is labeled as Direct. Common Direct scenarios include: pasting the short link directly into a browser, scanning a QR code that opens the browser directly, clicking a link in the desktop LINE app that opens an external browser, or mobile apps configured to open links in their built-in browser.
Important: To view links analytics, make sure the URL you are using was generated by PicSee.